Increase Revenue by Increasing Your Churn Rate
In a power-law book, the blended churn rate is set by the accounts worth the least, so if you aim your retention effort at that number, you'll spend it in the wrong place.
By Joseph Brady · November 16, 2026
Every portfolio review has the slide. It’s the churn rate, month over month, blended across the whole book. There’s a target next to it, and the target is always lower. Someone has done the math on what a small improvement would be worth, and it’s always a big number, because a little less churn every month, compounded over years, is worth a fortune in future revenue.
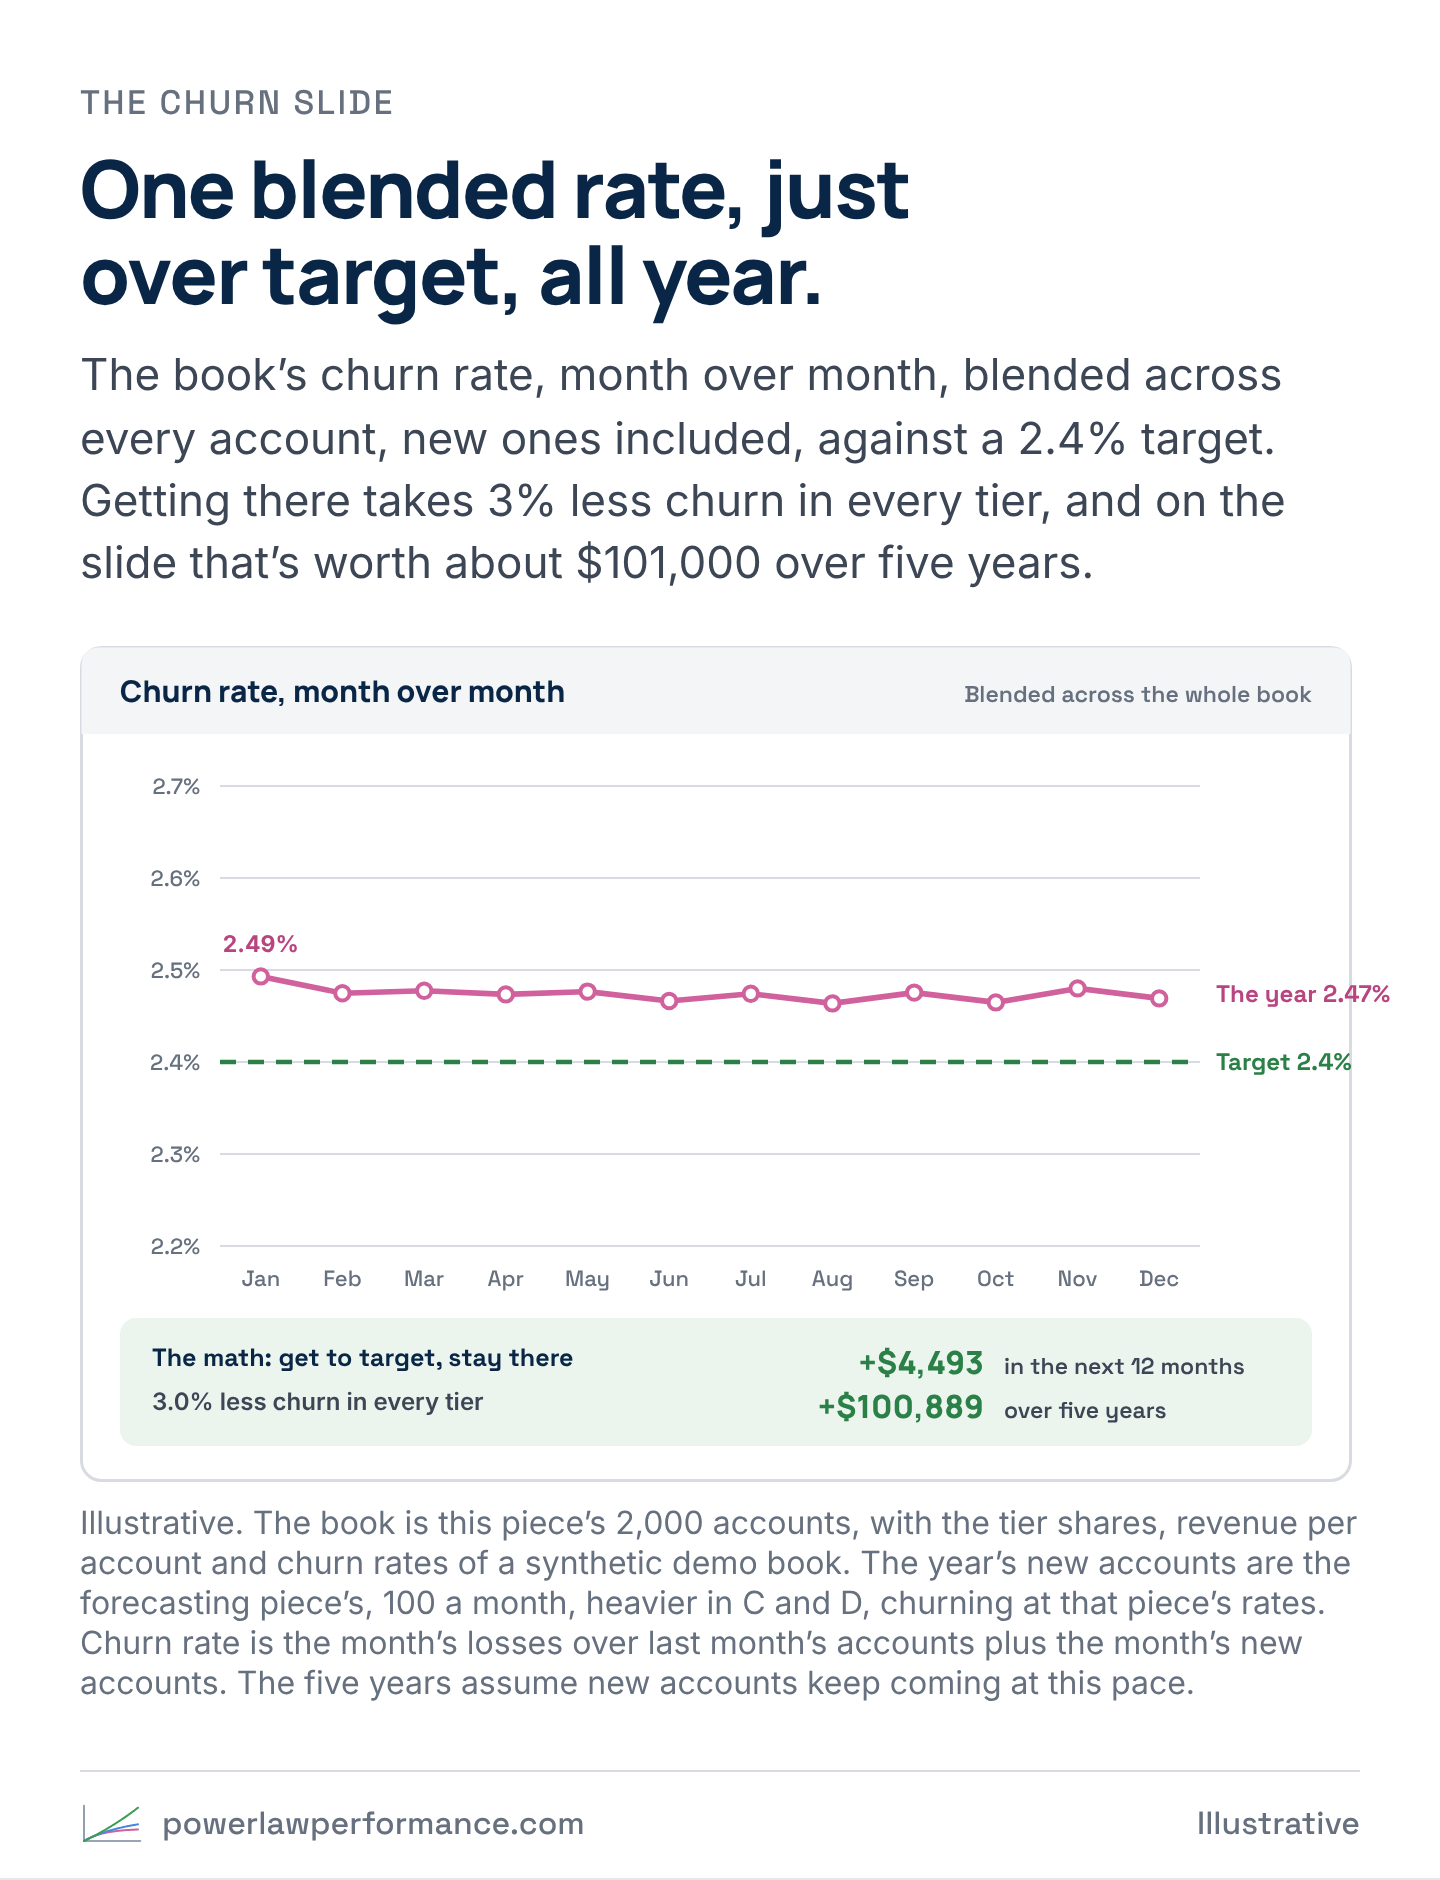
Somebody in that room should be arguing the other way. In a lot of businesses, the fastest way to grow revenue from the book you already have is to let the churn rate go up.
The number everyone’s chasing
The blended churn rate is simple. You take the accounts you lost this month and divide by last month’s accounts plus the ones you signed this month. Every account counts once, whether it’s your biggest customer or your smallest.
So your retention team gets a target to bring that number down. And because the number treats every account the same, the work does too. Every at-risk account gets the same save call, the same check-in schedule and the same retention offer. It feels fair, it’s easy to run, and when the number moves, everyone can see it on the slide.
All of that is reasonable, and all of it is aimed at the wrong end of the book.
Who actually sets the blended rate
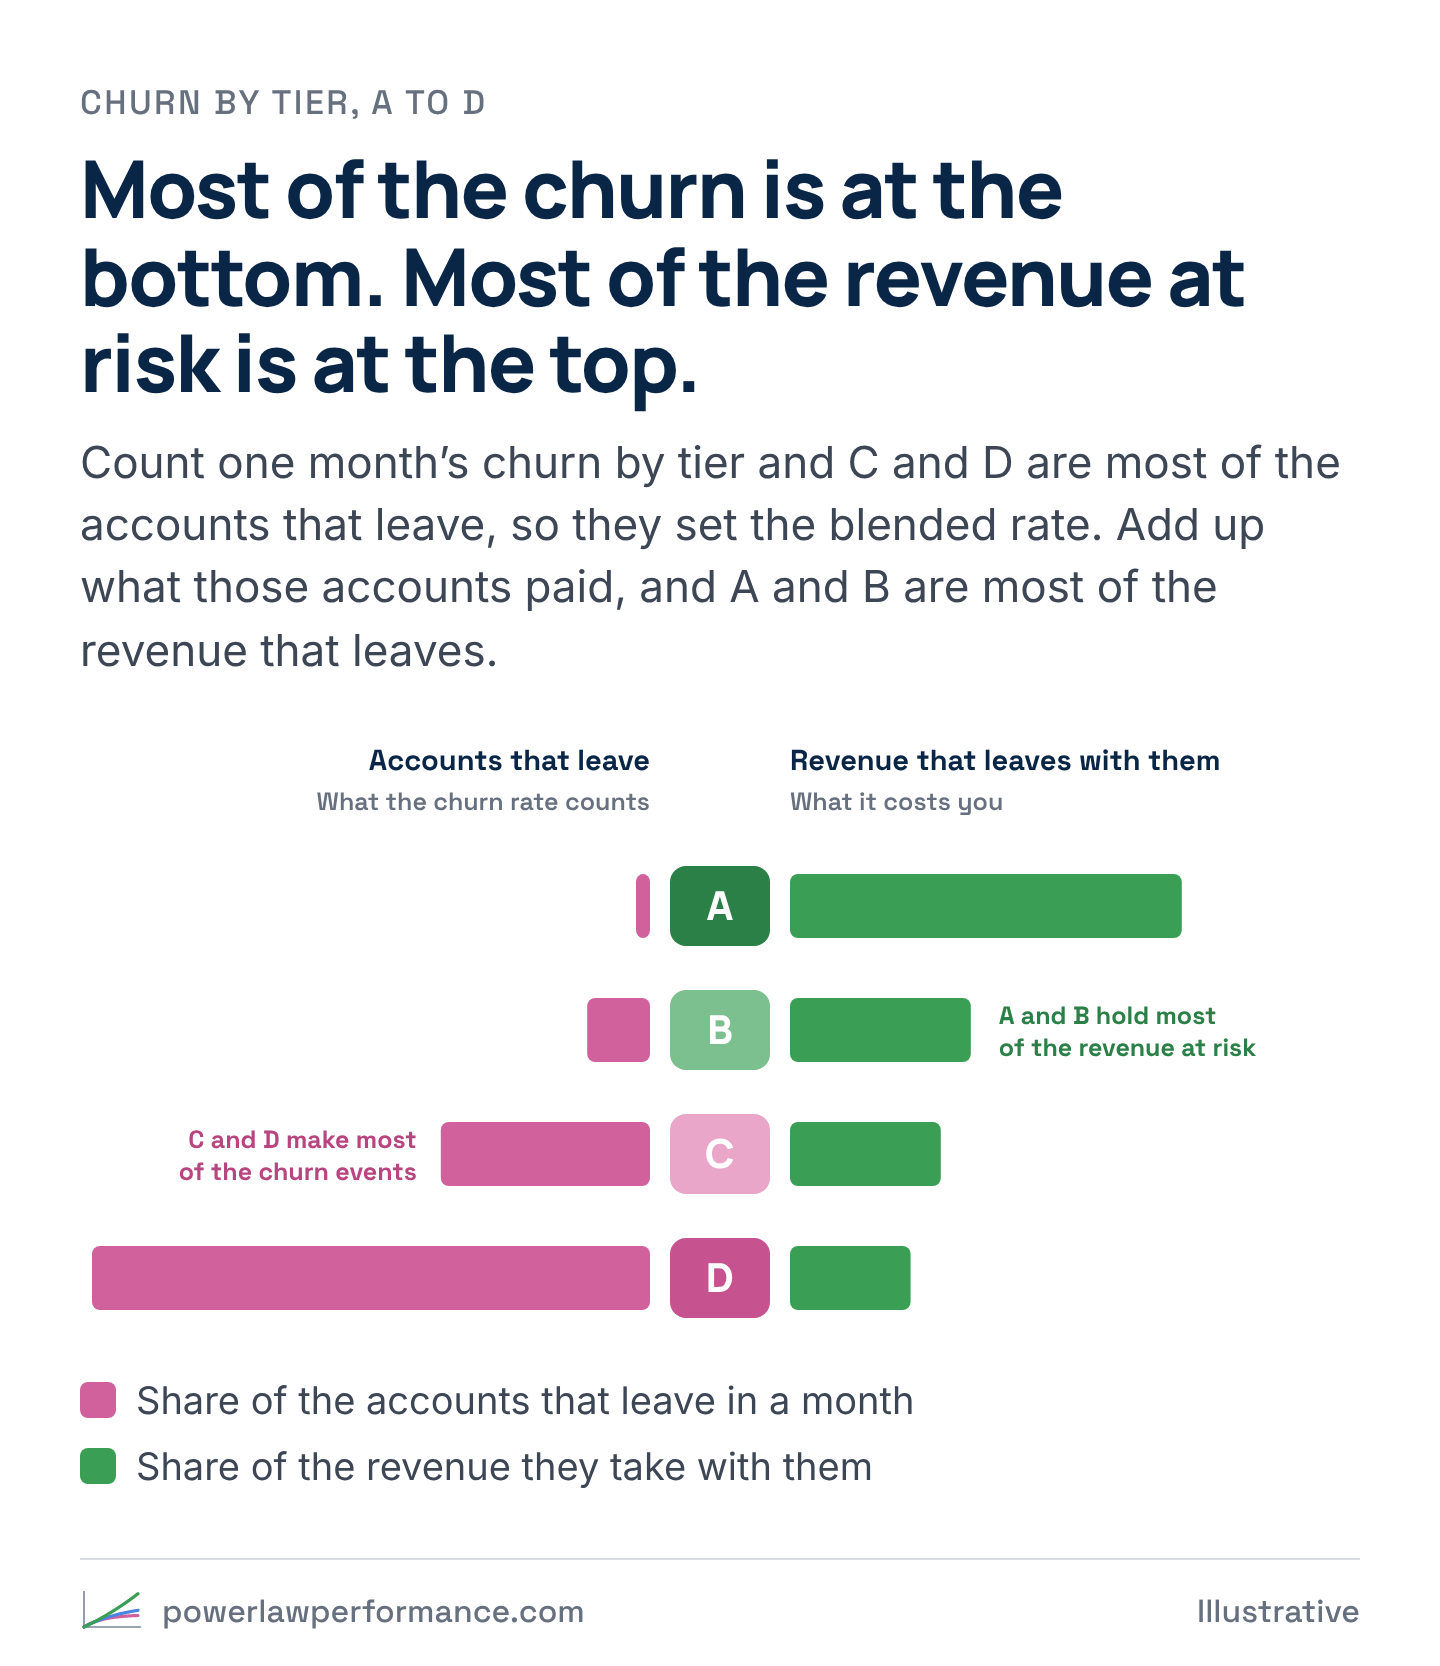
Lay your accounts out by what they’re worth, and in most recurring revenue businesses you get a power law. A small number of accounts carries most of the revenue, and a long tail of small accounts makes up most of the count.
Those small accounts also churn the most. They have the least invested in you and the least to lose by leaving, and they have the thinnest margin for staying in business at all.
Now put those two facts together. The bottom of the book has the most accounts and the highest churn, so it produces most of the churn events. So what is the blended churn rate really measuring? Mostly your least valuable accounts.
Your top accounts barely register in it, because there are so few of them. Lose one of your biggest customers and the churn rate hardly moves, but the revenue report takes a real hit. Lose a pile of small accounts and the churn rate jumps, and revenue barely notices.
Where the effort goes
Now give a team that target and an even split of resources. Where does the work go?
It goes to the churn events. The quickest way to move the rate is to save the accounts most likely to leave, and those are the least valuable accounts you have. So the save calls, the discounts and the service hours flow toward the bottom of the book, costing more than those accounts will ever return.
Software now builds a lot of the save list. Customer success platforms and AI churn-prediction tools score every account on its risk of leaving and line up the save calls, and ranked on risk alone, the list starts with the accounts at the bottom of the book.
Meanwhile, the accounts that carry the business get the same generic attention as everyone else, and no more. When one of them starts to drift, nothing in the target flags it, because losing it would barely touch the number.
It’s the same mistake as the free Lamborghini billboard, just in reverse. The billboard counted every sale the same and bought the cheapest ones. The churn target counts every lost account the same and spends its effort saving the cheapest ones.
The blended rate is worse than that
A blended monthly churn rate also mixes accounts of every age, so it improves in a slow sales quarter and gets worse in a great one, even when nothing about how well you keep customers has changed. Biases in Traditional Retention and Churn Analysis lays out the research behind that.
So how much is that number really telling you about your business? It moves when nothing you control has changed, and it’s dominated by the accounts worth the least. Not much.
Read churn by cohort, as a share of what it started as
So what’s the better way to read it?
Take each month’s new accounts as a cohort, and follow that cohort over time as a percentage of what it started as. Look at how many of its accounts are still here and, more importantly, how much of its starting revenue is still here, a month later, three months later and a year later.
Then split every cohort into Tiers A to D, and now you can see what’s really happening. You can see which tier is leaving, how fast, how much revenue walks out with them, and whether this year’s cohorts are holding on better or worse than last year’s.
Read each account at its lifetime tier, the highest tier it has reached. An account that shrinks on its way out still counts against the tier it earned, so a big account’s loss shows up in the tier it belongs to.
Read left to right, each tier’s line is what’s left of it after its churn, month after month: the book less the churn. On 2,000 accounts with the tier shares and churn rates of an invented sample book, no client data, tier A keeps 75% of its accounts after two years and tier D keeps 48%. The average depends on what you count. Counted in accounts, it ends at 55%, down near D, because that’s where most of the accounts are. Counted in revenue, it ends at 67%, between A and B.
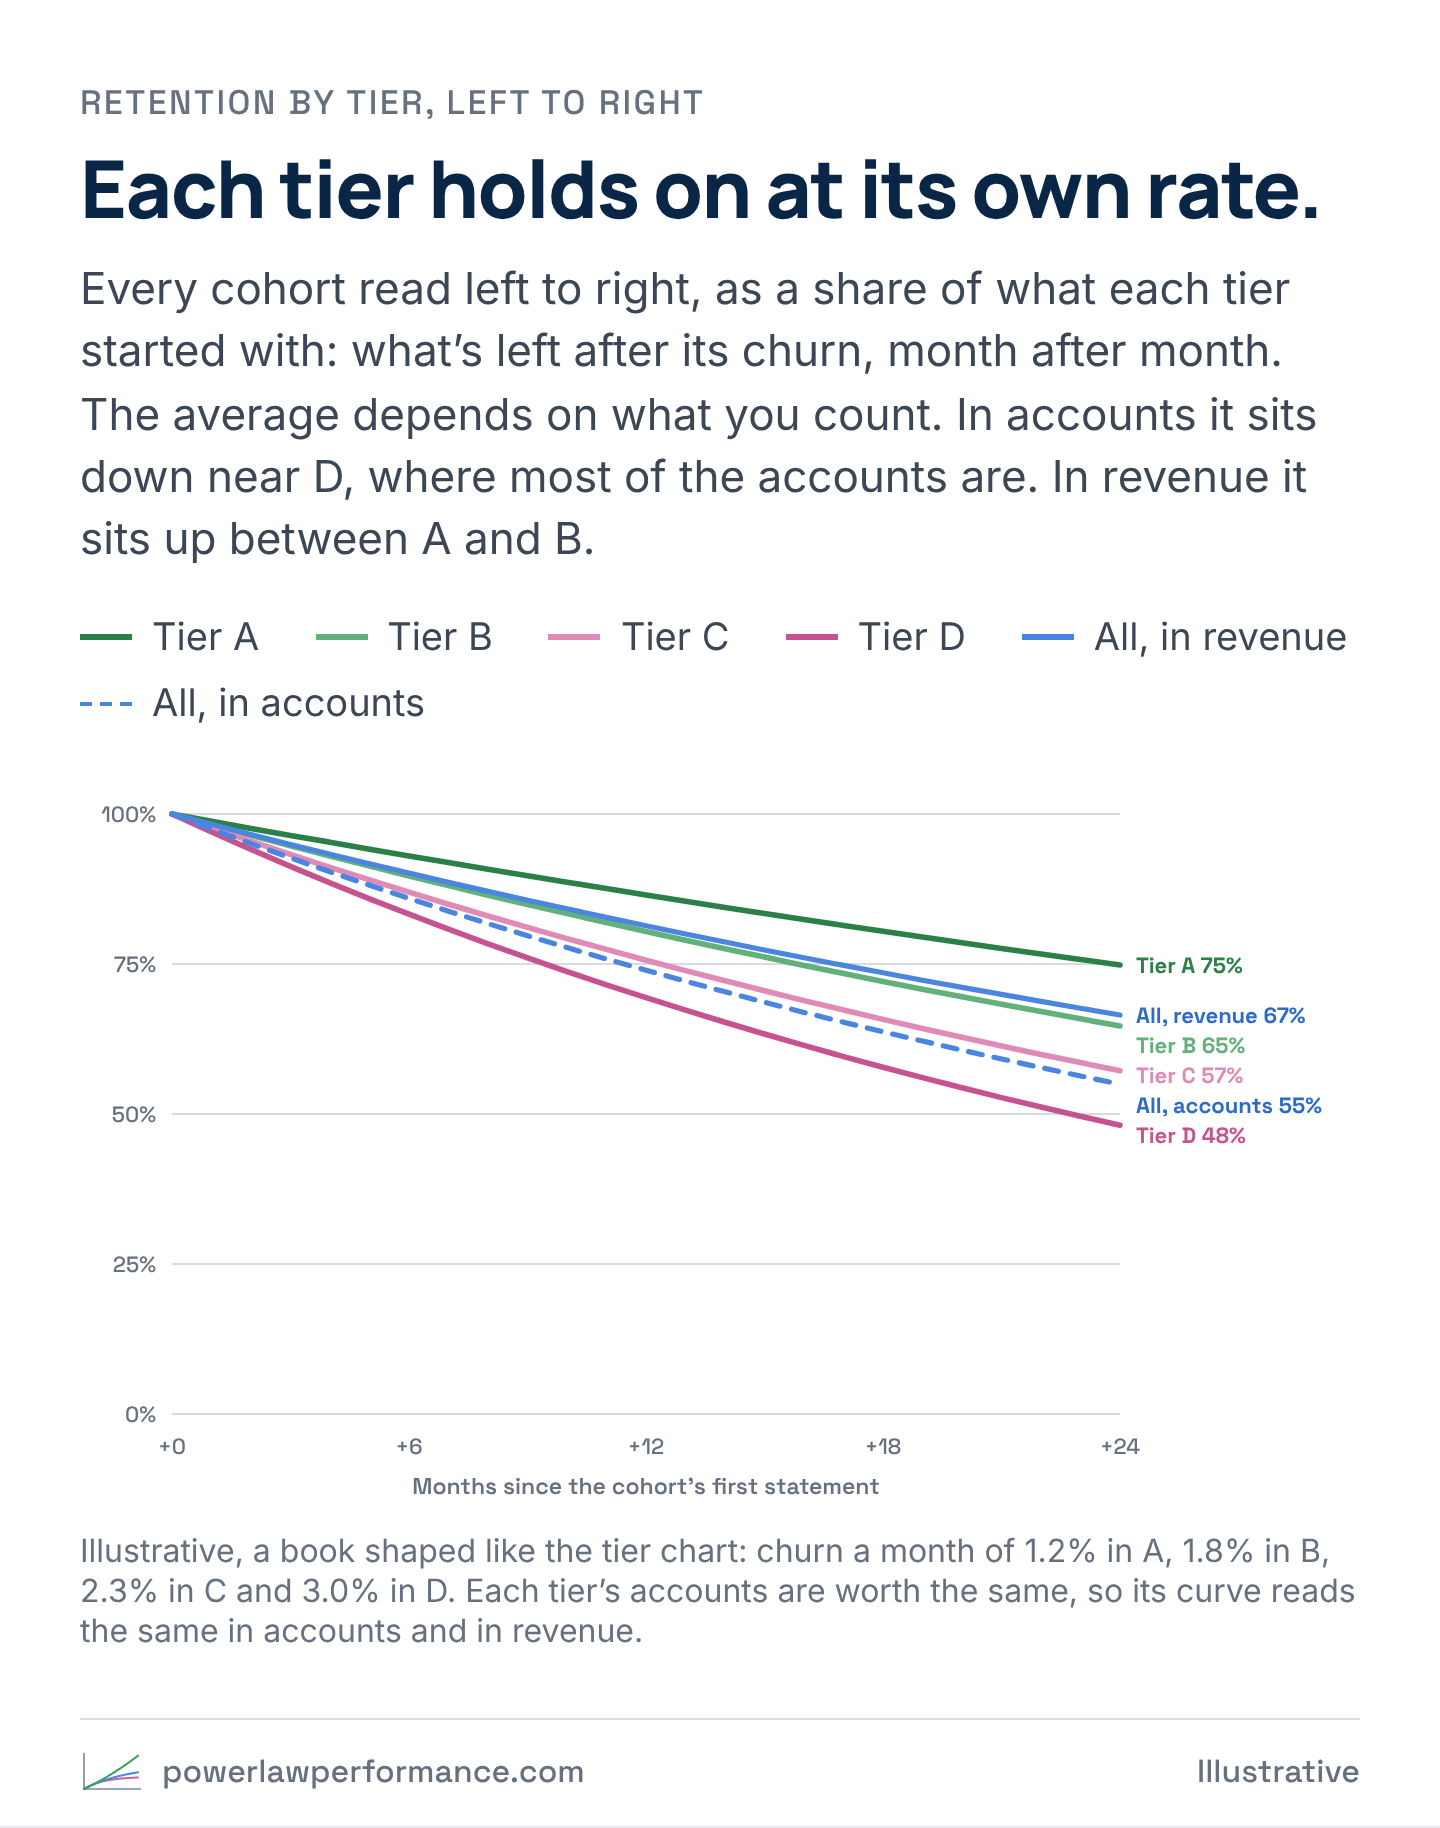
Read it that way and you’ll find two stories hiding inside one blended number. There’s a bottom tier that churns fast no matter what you do, and a top tier whose small slippage is costing you far more.
Let the churn rate go up
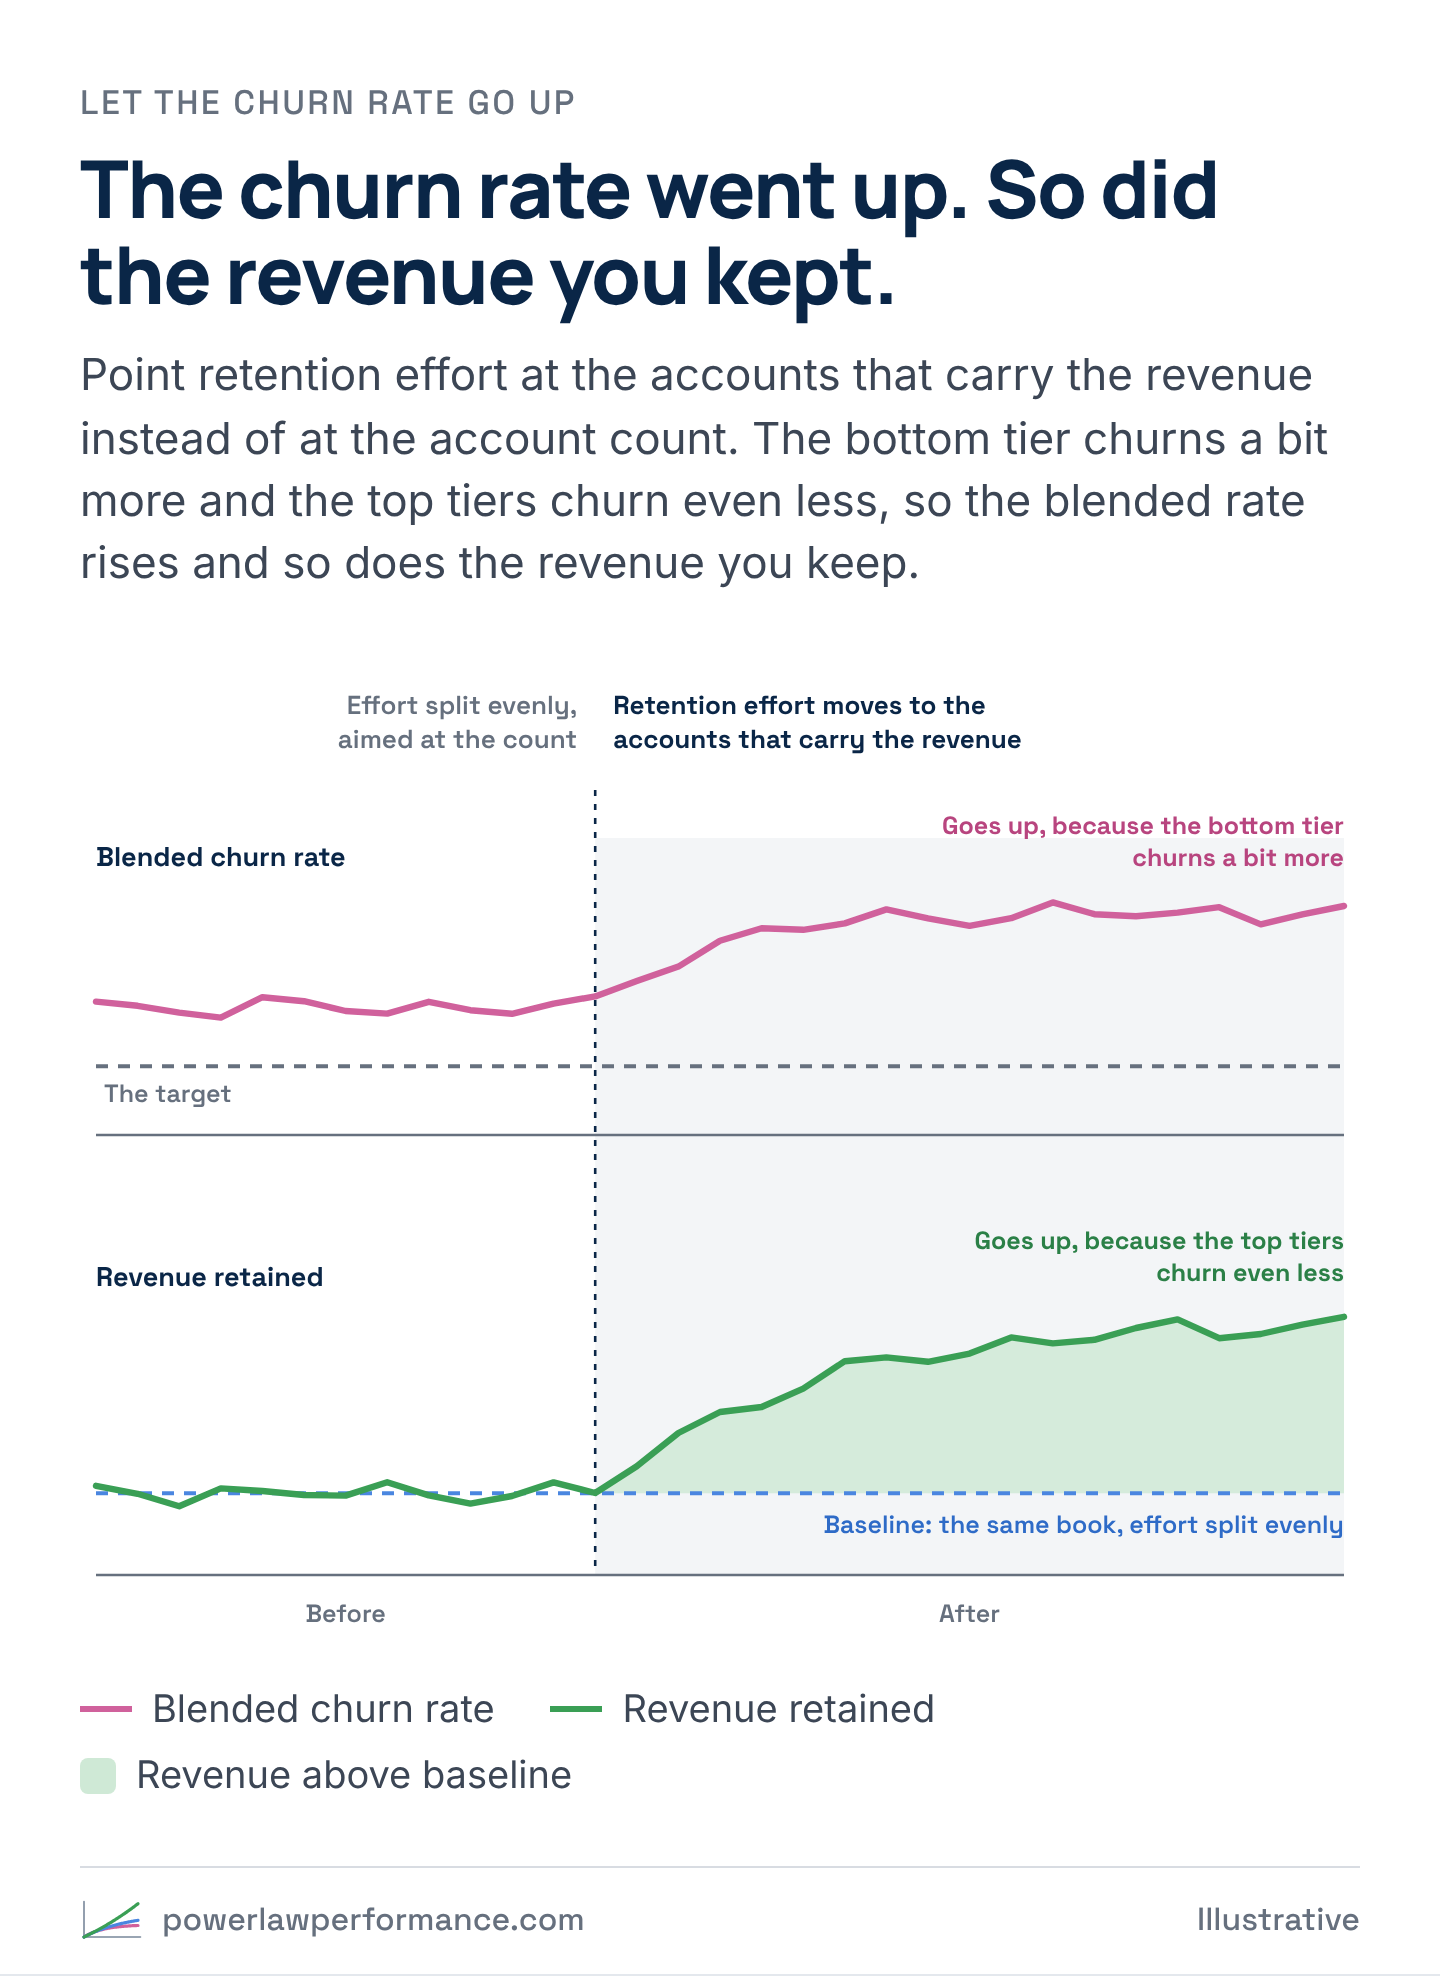
Now flip the allocation, and point your retention resources at revenue instead of at account count.
The accounts that carry the revenue get proactive attention, like someone who knows them, faster service and a pricing review before a competitor offers one. The accounts at the bottom get a good, low-touch, self-serve experience, and when keeping one would cost more than it’s worth, you let it go.
So what happens to the numbers? The top tiers churn even less and the bottom tier churns a bit more. And because the bottom tier sets the blended rate, the blended churn rate goes up.
Revenue goes up too. The accounts you kept are the ones that pay, and the ones you stopped chasing were costing you more to save than they were worth.
How much better does the top of the book have to do to pay for letting the bottom slip? Less than you’d think. Let tier D’s churn rate go up 10%, from 3.00% to 3.30% a month, and A, B and C need to churn only 1.8% less for the next 12 months’ revenue to hold. If they churn 10% less, the next 12 months bring in about $8,500 more (0.8% of a year of about $1.12M), revenue lost to churn falls 6.5%, and the churn rate on the book alone, before new accounts, climbs from 2.50% to 2.55%, further over its 2.4% target.

Slide it the other way and the trap shows up. Spend the effort on D instead, cut its churn 10% and let A, B and C slip 10% for it, and the churn rate improves to 2.45% while the next 12 months bring in about $8,300 less (0.7%).
So can you increase revenue by increasing your churn rate? Yes, and nobody has to treat small customers badly to do it. You just stop letting a count-based number decide where your best people spend their time.
Who was driving
Why did the blended churn rate become the target? Because it’s one number, it’s easy to compute and it fits on a slide. Nobody chose to spend the retention budget on the least valuable accounts. The number did that, because it pulled the effort toward whatever moved it, and what moved it was the bottom of the book.
If you have finite resources and you’re deciding where to deploy them across a portfolio, the question to ask is how to keep the most revenue with what you have. That’s a different question from how to lose fewer accounts.
What to measure instead
- Retire the blended monthly churn rate as a target. Keep it as a footnote if you have to, but don’t manage to it.
- Read churn by monthly cohort, as a percentage of what each cohort started as. Do it in accounts and, above all, in revenue.
- Break every cohort into tiers. Use A through D, so you can see which part of the book is actually leaving.
- Set retention targets in revenue, by tier. Revenue retained from your top tiers is the number that matters.
- Spend retention effort by value. Put the most attention where the most revenue is at risk, and keep the long tail low-touch.
- Watch for early signals at the top. Look for usage or volume slipping, support tickets piling up or a contract date coming up. The earlier you see a top account drifting, the more a save is worth.
- Read it against baseline, over time. Compare each cohort’s retained revenue with what the business would have kept anyway.
Expect the blended churn rate to go up. That’s the point.
Back to the slide
Next quarter, the portfolio review has the same slide. The blended churn rate is higher than last quarter, and someone’s going to ask why.
The answer is on the next slide. Revenue retained from the accounts that carry the business is the best it’s been, and the churn rate went up because you stopped spending your best people on the accounts worth the least.