Implementing Drag: How Lowering Conversion Rates Can Increase Performance
Why a step that lowers your landing page's conversion rate can raise the share of clicks that become sales, and how to build it, measure it and keep it long enough to prove it.
By Joseph Brady · November 9, 2026
The landing page report is on the screen, and the new form looks like a mistake. Two weeks into a 50/50 test, the multi-step version converts a third less often than the single-step form, and its cost per lead is half again as high. Someone asks the question everyone in the room is thinking. Why not call the test now and keep the old form?
Then the head of sales speaks up. “Don’t touch it. We’re finally getting people on the phone.”
Both of them are reading their numbers correctly. The new form is turning fewer visits into leads, and sales is reaching more of the leads it sends. So which number decides whether the form stays?
Neither one, on its own. The number that decides it runs from the click all the way to the sale, and it’s on almost nobody’s report. That’s why changes like this get rolled back.
This article is about making that kind of change on purpose. Drag is a step you add that lowers a conversion rate early in the funnel, so that the rate that matters, clicks to sales, goes up. It runs against everything the testing playbook teaches, which is why it has to be built with care: where it goes, how to build it, how to measure it, and how to keep it in place long enough for the right number to come in.
In the funnel set out in the guide Implementing Signals and Attribution, drag goes in at the conversion, before the lead and the MQL, and what it buys shows up from the SAL on, where the conversations start.
The true conversion rate runs from click to sale
Every team in the funnel reports its own conversion rate. Marketing reports the landing page’s, leads per click. Sales reports its contact rate, the share of leads someone actually talks to, and its close rate. Each of those numbers is real, and each one is a single link in a chain.
Multiply the links together and you get the true conversion rate, the share of clicks that become sales:
Click to sale = landing page conversion rate × contact rate × application rate × close rate
Use the stages your own funnel has. A business that sells without an application has one less link, and one that sells through a demo has a different one. What matters is that they multiply.
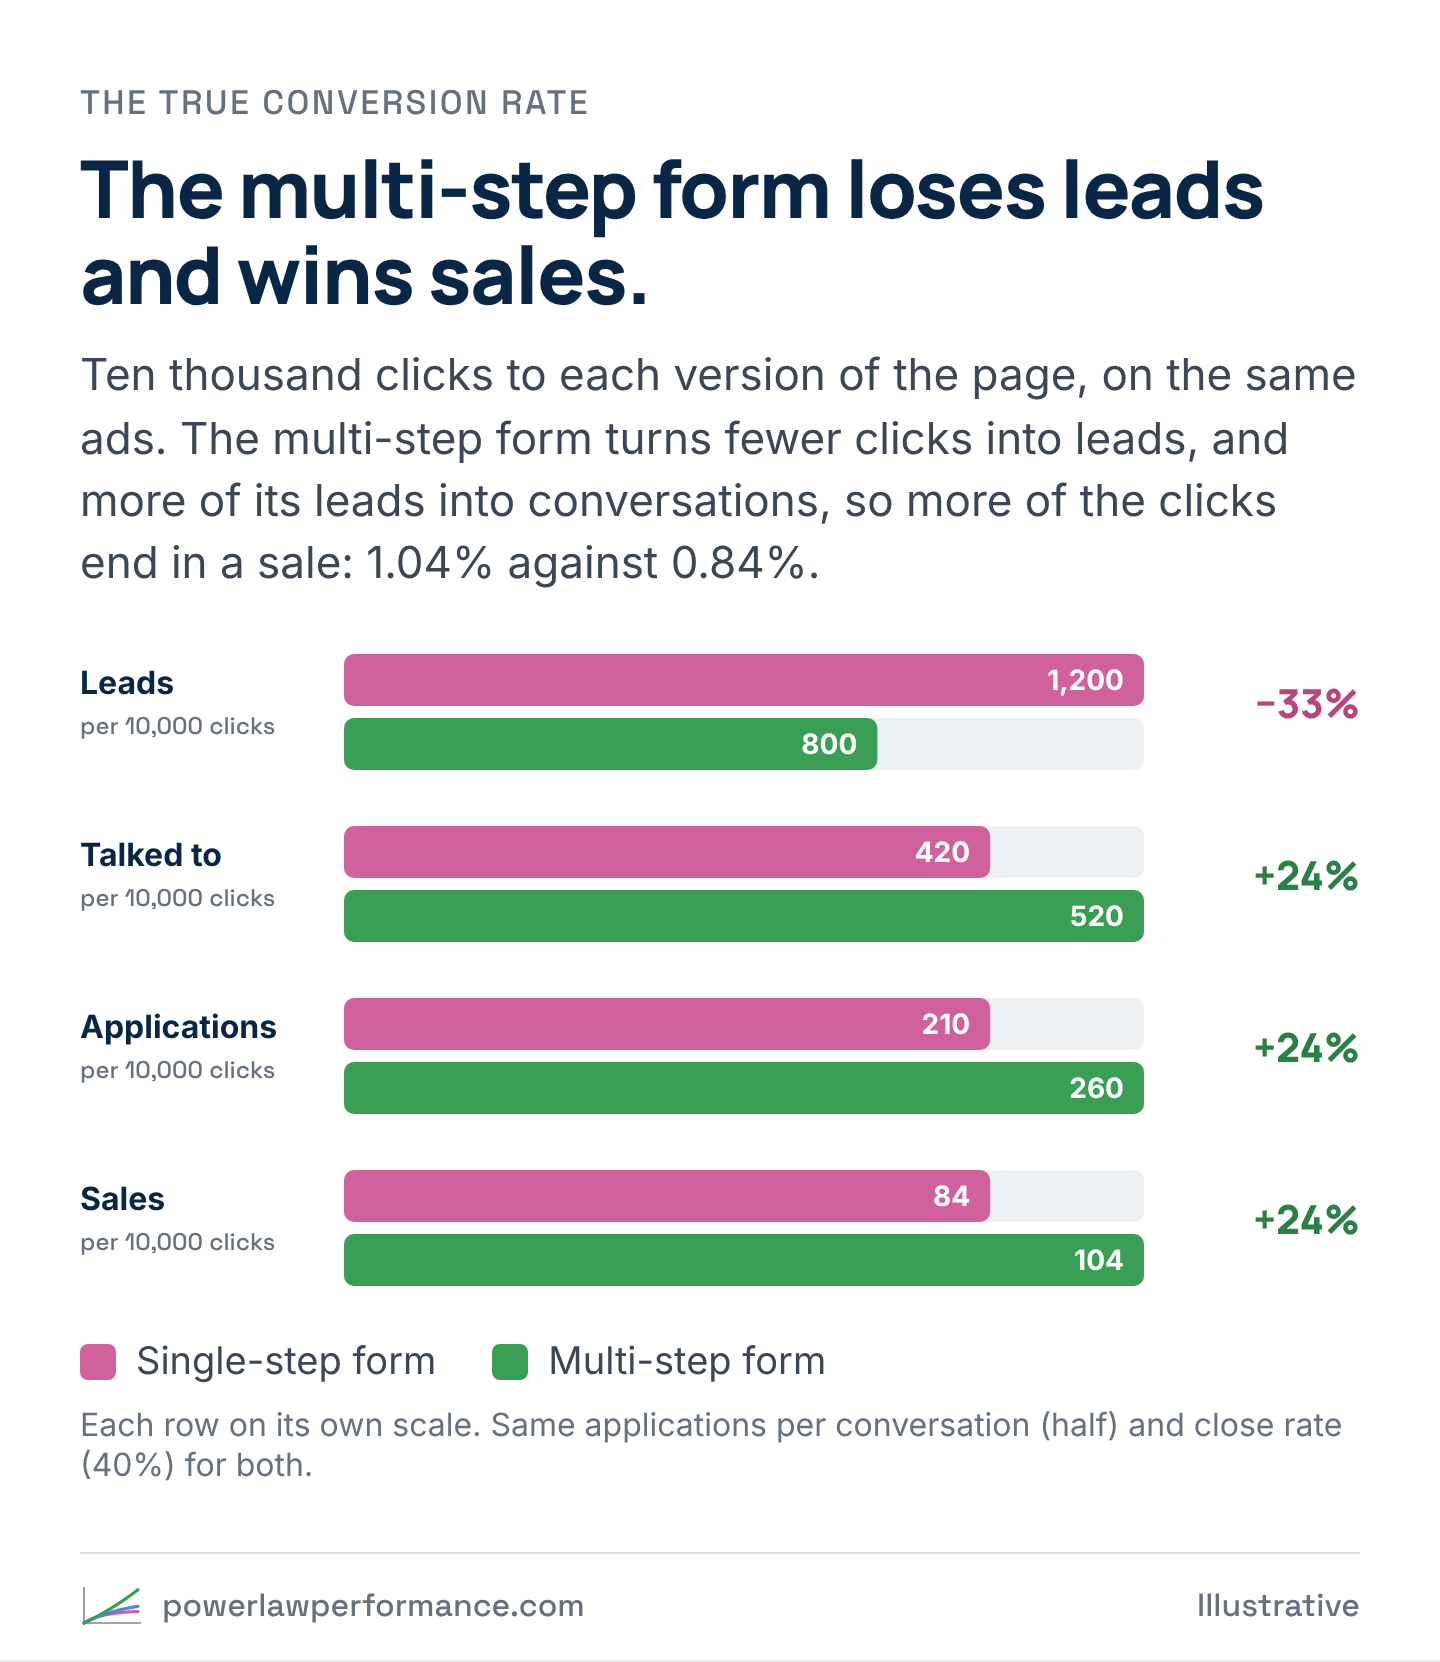
And because they multiply, a change that lowers one link and raises another is a win whenever the product goes up. Take two versions of the same page, and send 10,000 clicks to each, on the same ads, at the same cost.
| 10,000 clicks to each, at $2 a click | Single-step form | Multi-step form |
|---|---|---|
| Landing page conversion rate | 12% | 8% |
| Leads | 1,200 | 800 |
| Contact rate | 35% | 65% |
| Leads sales talked to | 420 | 520 |
| Applications (half of those talked to) | 210 | 260 |
| Sales (40% of applications) | 84 | 104 |
| Click to sale | 0.84% | 1.04% |
| Cost per lead | $16.67 | $25.00 |
| Cost per sale | $238 | $192 |
Illustrative.
The multi-step form loses a third of the leads and still turns the same clicks into about a quarter more sales. Cost per lead rises by half. Cost per sale falls by almost a fifth. Every report in the building tells a different story about the same change, and only one of them runs from the click to the sale.
To sales, the change looks like a bigger budget. The team gets 100 more conversations out of the same 10,000 clicks, 24% more. With the old form, those conversations would cost about 24% more budget, and that’s if the extra budget could buy clicks at the same price.
None of this is new. In 1923 Claude Hopkins, whose Scientific Advertising made the case for testing every ad, wrote, “One ad may bring too many worthless replies, another replies that are valuable. So our final conclusions are always based on cost per customer or cost per dollar of sale.” A century later, most landing pages are still judged by the cost per reply, because that’s the number the landing page report shows.
What drag is
Drag is a step you put in on purpose, in a known place, that weighs more on the leads you don’t want than on the ones you do. It lowers the conversion rate where it sits, and it’s judged on the rate from the click to the sale.
Friction is different. Friction costs everyone the same: a slow page, a form that makes someone on a phone type what they could have tapped, a button hidden behind the keyboard, a field nobody ever reads. It lowers the conversion rate and buys nothing back. So there are two jobs here, and they pull in opposite directions. Take out every bit of friction you can find, and put drag where it sorts.
The idea has a long history in economics. Albert Nichols and Richard Zeckhauser called a requirement like this an “ordeal” in 1982, and a field experiment in 400 Indonesian villages, published in 2016, found that a small application cost steered a cash-transfer program toward the poorer households, while making the application a little costlier didn’t steer it any better. The library’s explainer has the experiment. The lesson for a form is the same one. A single small ask does the sorting.
Drag isn’t only a form. It’s any change that lowers a rate you report, made on purpose: a minimum named in the ad, a phone number kept on the page, a conversion the platforms only hear about when the answers clear a line. The multi-step form is the one most teams can build and test this quarter, so most of this article builds that one. The same method judges the rest.
Why a harder form gets more people on the phone
A multi-step form doesn’t just make the form longer. It changes who finishes, what they’ve decided by the time they finish, and what they expect to happen next. Five things happen at once. None of them shows up on the landing page report, and all five show up in the contact rate.
The people who finish chose to. Each step asks for a little more, and a visitor who’s only half interested leaves at the step where the effort stops being worth it. A visitor with a real need keeps going. The leads that come through are the ones who wanted the next step, and the next step is a conversation.
The easy part comes first. A good multi-step form opens with a question about the business that takes one tap, not a request for a phone number. Joseph Sugarman wrote that “The sole purpose of the first sentence in an advertisement is to get you to read the second sentence.” The first step of a form has the same job, which is getting the second step done. By the time the form asks for a phone number, the visitor has already answered questions about the business and decided to keep going. Sugarman’s Adweek Copywriting Handbook calls the copy version the slippery slide.
Small yeses add up. Robert Cialdini explains the pull in the chapter on commitment and consistency in Influence: “Once we have made a choice or taken a stand, we will encounter personal and interpersonal pressures to behave consistently with that commitment.” A visitor who has picked a monthly sales band, picked how long the business has been open and asked to hear back has said yes three times before the phone rings.
The contact details are better. The fake numbers and throwaway emails thin out, because the people who’d type them leave before the step that asks. And because the answers came first, the rep knows what the call is about before dialing.
They know a call is coming. The form says who will follow up, and the thank-you page says who, from which number and when. Meta builds the same idea into its own lead forms. Its default instant form type, More volume, is “designed to generate a larger number of leads.” Its Higher intent type adds “Inline context under contact fields to indicate that your business may follow up” and “An additional review screen that gives people a chance to confirm their information.” Meta’s help page says those two features “help you receive more intentional submissions and prevent receiving submissions from those people who are only marginally interested in your product or service.” So the platform itself offers a setting that trades volume for intent.
Where drag goes
The form is one place. Drag can go anywhere between the ad and the first conversation, and each place lowers a different rate on a different report.
| Where | The drag | The rate that drops | The rate it’s there to raise |
|---|---|---|---|
| The ad | Name who it’s for: a minimum, a price, the kind of business | Click-through rate, so cost per click rises | The share of clicks that could ever buy |
| The audience | An audience seeded from your best accounts, where the platform allows it for your ad category | Leads per dollar | The share of leads that look like your best accounts |
| The bidding | Send the platforms only the qualified conversion | Conversions the platform reports, so its cost per result rises | Above-average accounts per dollar |
| The page | Keep the phone number, and state the requirements | Form fills | Calls, and the share of leads that qualify |
| The form | Two steps, with the sorting question first | Landing page conversion rate | Contact rate and the share of leads that reach MQL |
| The confirm step | A review screen, or a code texted to the phone | Finished submissions | Reachable leads |
A few of these deserve a word.
The ad. An ad that says who it’s for loses the clicks from everyone it isn’t for. On platforms that bill by the impression, a lower click-through rate means a higher cost per click, so the ad looks worse on the ad report and better on every report after it.
The bidding. Counting only the leads whose answers clear the line lowers the conversions the platforms report and raises their cost per result. It’s been run in practice. Across millions of dollars in ad spend on the major algorithmic advertising platforms, replicated across additional advertising accounts and businesses, counting only the business owners who said they did over $30,000 a month raised that group from as low as 5% of respondents to 50%. Cost per acquisition rose. The share of above-average accounts rose sharply, and the revenue return rate rose dramatically.
The page. Remove the phone number and the form wins on fills, while the calls, the leads most ready to talk, thin out. Keeping it there is drag on the form and a door left open for the buyer who’d rather call.
The confirm step. A review screen or a texted code catches the wrong numbers before they reach sales. It asks more of everyone than a second step does, so test it on its own, after the form.
Each of these is its own test, judged the same way. The rest of this article builds the form, because it’s where most teams start, and the measurement that judges it works for every row in the table.
Remove friction, add drag
Drag works when it weighs more on the leads you don’t want than on the ones you do. Get that backwards and the step screens out your best prospects, and the landing page report and the sales report both get worse.
It happens outside marketing too. Research on disability programs found that when field offices closed, fewer people received benefits, the drop was steepest among applicants whose conditions were moderately severe, and the targeting got worse (Deshpande and Li, 2019). So judge any step by who it drops, not by how many.
Signs a step is the wrong kind:
- It costs your best prospects more than your worst. A step that asks a busy owner to book a half-hour slot before anyone has spoken to them screens out busy owners.
- It asks for something nobody uses. Every field should be read by someone, score the lead or route it. A question that does none of those is friction.
- It asks about the person instead of the business. Personal finances, health and anything close to a protected trait can’t be used as a signal on the platforms, and ads for credit, housing and jobs carry legal limits on top. Questions about the business sort without that problem.
- It stacks. One small ask does the sorting, and the Indonesia experiment found that making the application a little harder didn’t improve the targeting. On a landing page, the version of this is a full application, three pages long, where most visitors leave after page one. The application belongs after the first conversation, not before it.
Friction to take out at the same time:
- Typing where a tap would do. When most of the traffic is on a phone, every question that can be buttons or a dropdown should be, and the questions that need a keyboard go last.
- A reload between steps. Keep both steps on one page, so the second step appears instantly and nothing the visit carried gets lost.
- A button the keyboard covers, an error that clears the form, a phone field that rejects a number with spaces in it.
- A slow page. Every second of loading costs everyone the same, so it sorts nobody.
And keep the other doors open. Drag on the form shouldn’t block the buyer who would rather call. The phone number stays on the page, with its own tracking number, so those leads are counted too.
Build the multi-step form
Two steps and a thank-you page cover it. This is the answers-first order, one of the two the Broad Eye Solutions blueprint covers. With the contact details first instead, step one creates the lead and the later steps update it.
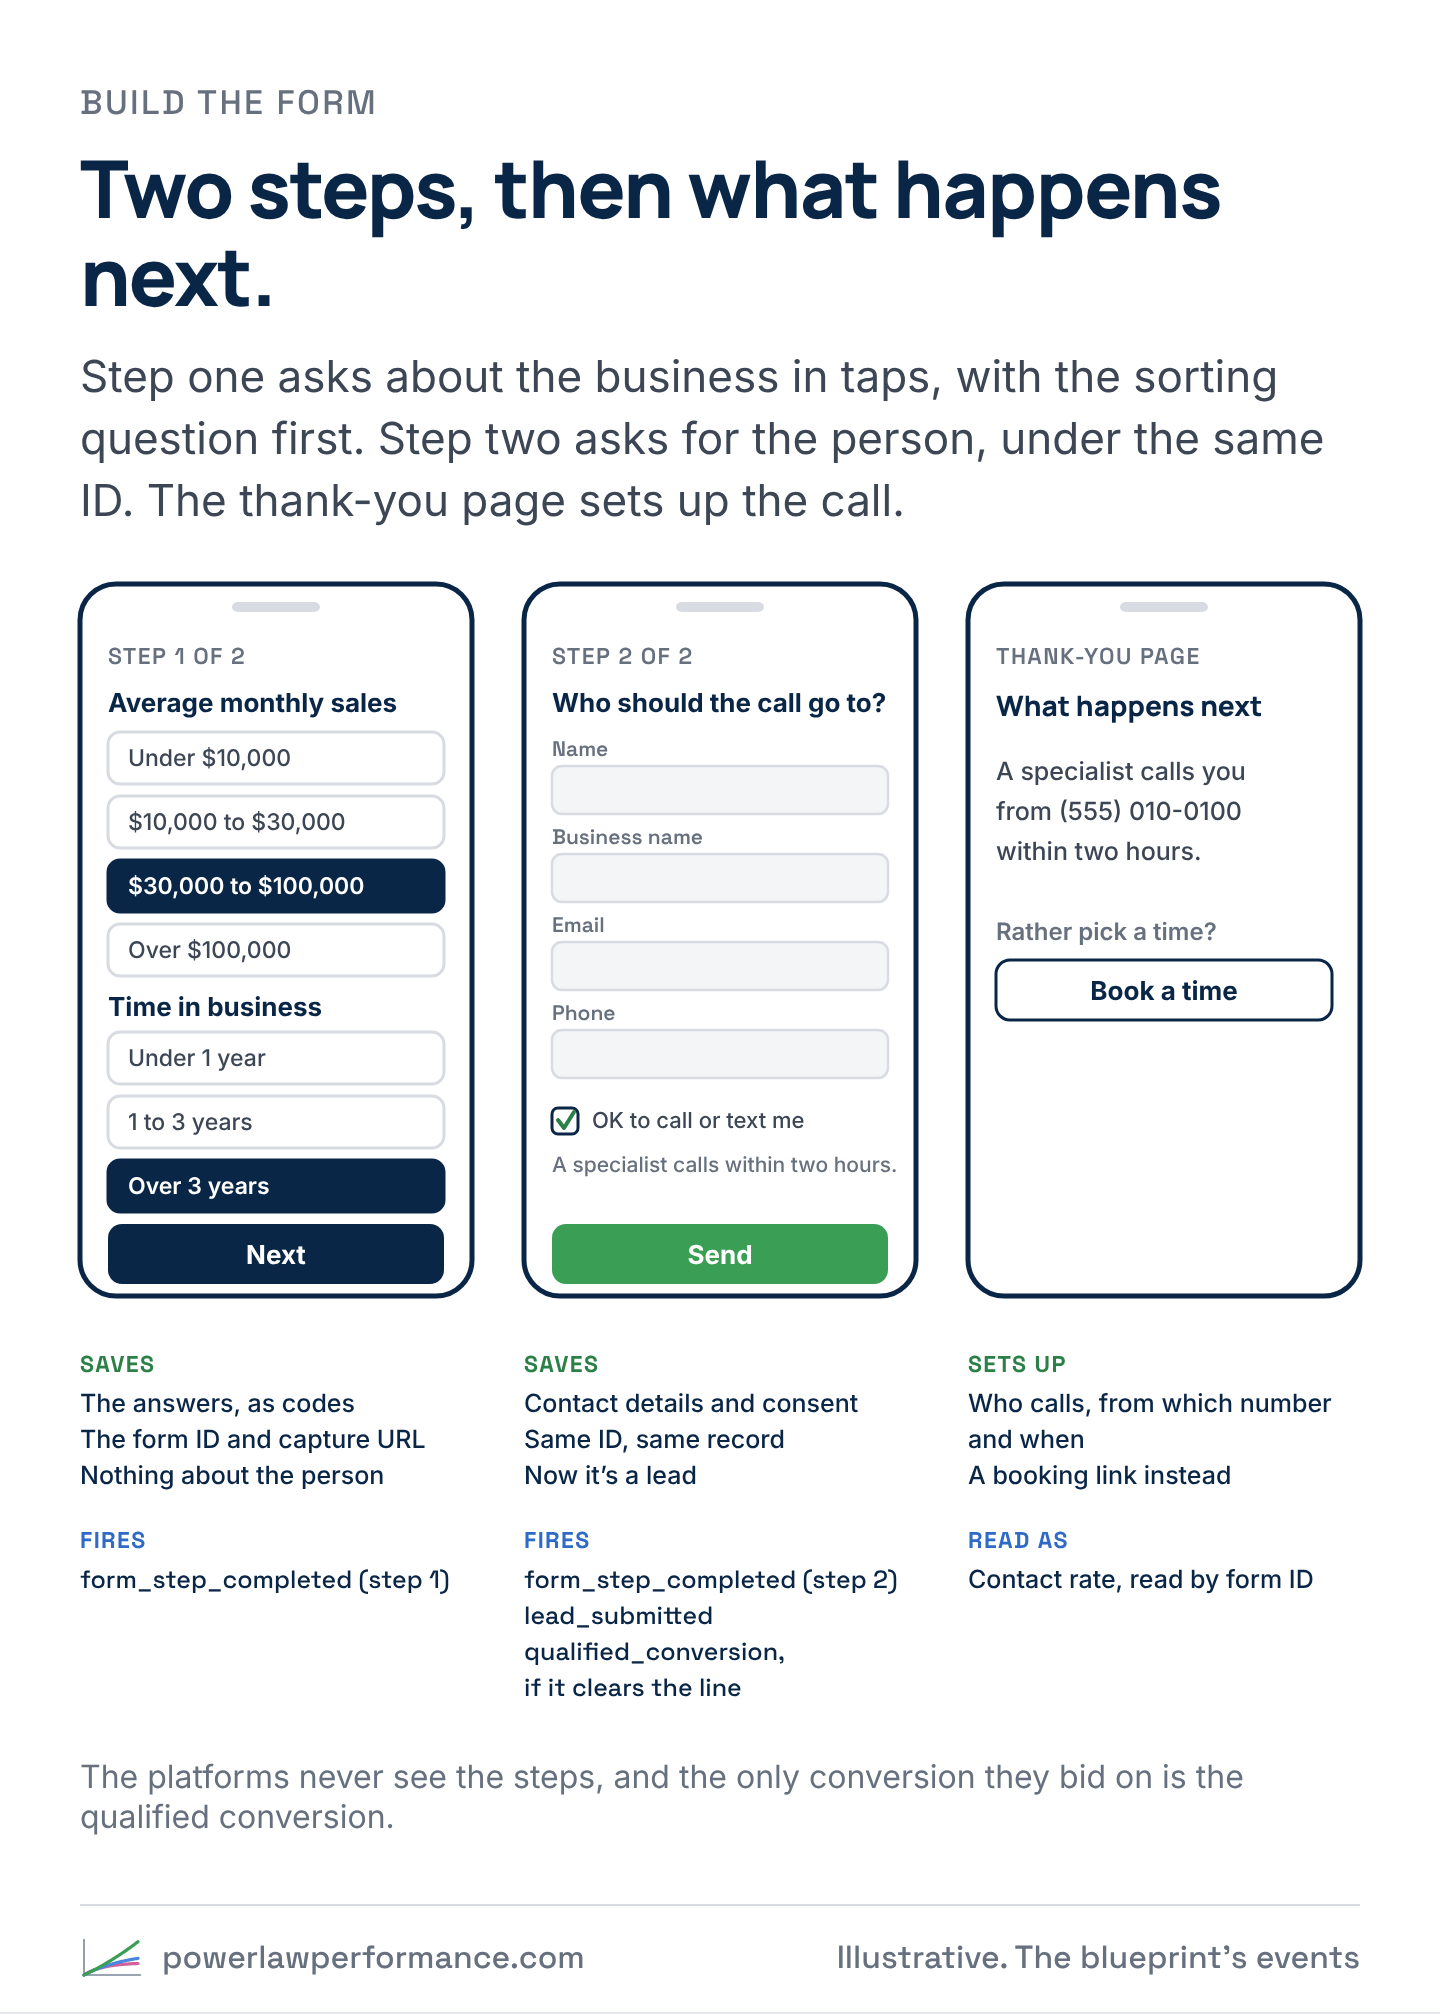
Step one: the business, in taps. One to three questions, each one a set of buttons or a dropdown, with no typing. The sorting question goes here, the one that predicts what a lead is likely to be worth, such as monthly sales in bands. Show “Step 1 of 2” so nobody wonders how long this is going to take. If there’s a minimum, say it here, next to the question, in plain words.
Step two: the person. Name, business name, email and phone, then the consent checkbox if sales will call or text, with the exact wording the visitor saw kept on the record. Check the phone number’s format as it’s typed, and say under the field who will follow up.
The thank-you page: what happens next. Who will call, from which number, and when. A link to book a time, for the people who’d rather pick one. For a product that can be bought without a call, an order link can sit beside it, tested the same way as any other change, on contact rate and revenue.
In the answers-first order, each step saves to your own endpoint like this.
- The page creates one event ID when the form loads, and every step uses it. That ID becomes the lead ID.
- Step one posts its answers to your own endpoint, with the form ID and the capture URL, and nothing that identifies the person. The endpoint stores the answers as codes. This isn’t a lead yet, because there’s no one to contact.
- Step two posts the contact details and the consent with the same ID. The endpoint updates the same record, and that’s the moment it becomes a lead. Only then do
lead_submittedand, when the answers clear the line,qualified_conversionfire. - Nothing personal travels in the page address. Both steps live on one page, so nothing needs to.
- Records that stop after step one never go to sales. They’re the best data you have on the drag itself, because their answers show who the second step lost, band by band.
Each step also fires form_step_completed with the form ID and the step number, to your product analytics and nowhere else. The platforms never see the steps, and the only conversion they bid on is the qualified conversion, exactly as with a one-step form.
Give each version its own form ID. The single-step page keeps its ID and the multi-step page gets a new one. Every report that reads by conversion point then reads the test, with no separate tagging.
Split the traffic evenly, on the same ads, at the same time. Assign the version by visitor, so someone who comes back sees the version they saw before. Never compare this month’s form with last month’s. The ads, the season and the sales team all changed in between.
Count contact the same way every time
Contact rate is the number drag is there to move, and in plenty of CRMs it’s the least reliable number on file.
Write the definition down before the test starts. A workable one is that a lead is contacted when someone on the team has a two-way conversation with the person who sent it, on a call or in a written reply, within seven days. An attempt isn’t contact. A voicemail isn’t contact. An email sent isn’t contact. Pick the window that fits your sales cycle, and don’t change it in the middle of a test.
Then make the CRM able to count it:
- Log every attempt from the phone system, with its time. When calls don’t write themselves to the lead record, contact rate is whatever the reps remember to log.
- Give every attempt an outcome: connected, no answer, voicemail, wrong number, disconnected, wrong person, asked not to be contacted.
- Put bad data on its own line. A wrong number or a bounced email is a form problem, not a sales problem. Keep it apart from “not interested,” because drag is supposed to move it.
- Stamp the lead with its first attempt and its first conversation. That gives you speed to lead, and how long each lead took to reach.
- Read contact rate by form ID, source, answer band and hour of arrival. A lead that arrives at 9 p.m. has a different first day from one that arrives at 10 a.m.
Hold sales still while the test runs. Both versions’ leads go into the same routing, the same cadence, the same reps and the same first-attempt window. If the team handles late-day leads differently, with a lighter touch that evening and the full cadence the next morning, both versions get that. If one version’s leads keep landing with the best rep, the test is reading the rep, not the form.
Judge the test on click to sale
The landing page’s conversion rate stays on the report. It just stops deciding anything on its own. Each version gets one row on a scoreboard that runs the whole length of the funnel.
| On the scoreboard | What it tells you |
|---|---|
| Clicks and spend | Whether the split was even |
| Leads and landing page conversion rate | What the drag cost |
| Contacted, contact rate and bad data | What the drag bought, first |
| Applications | Whether the conversations were with the right people |
| Sales and click to sale | The verdict |
| Cost per sale | The verdict, in dollars |
| Above-average accounts and revenue per click, at three and twelve months | Whether it sorted on value, not just on who picks up |
Know the breakeven before you launch. The links multiply, so a drop in one has to be made up, in proportion, by the others. A form that cuts the conversion rate from 12% to 8% keeps two-thirds of the leads. To produce as many conversations as before, its contact rate has to rise by half, from 35% to 52.5%. Anything above that is a gain, as long as the conversations close as well as they did. Anything below it is a loss, however good the contact rate looks.
The calculator below runs the chain both ways. Move any link and watch the click to sale, the cost per sale and the breakeven contact rate. The presets show the drag that pays, the drag that doesn’t, and the drag that screens out the wrong people.

Read value, not just volume. If the drag sorts, the leads that get through aren’t just easier to reach. More of them become above-average accounts. Read each version’s sales by Power Law tier, the A to D split from the guide Implementing Signals and Attribution, at three and twelve months, grouped by the month the leads arrived, so a newer version isn’t judged against one that’s had longer to pay off.
The wrong number arrives first
Every test like this produces its numbers in the wrong order. The landing page’s conversion rate can be read in days. Contact rate takes weeks, because the leads need time to be called. Sales take months, and value by tier takes longer than that. So the number that argues against the drag is the first one on the table, and by the time the number that argues for it arrives, the old form is back.
The arithmetic is plain. At the usual test settings, 95% confidence and 80% power, telling the example’s two versions apart takes about:
- 900 clicks per version on the landing page conversion rate (12% against 8%),
- 7,000 clicks per version on conversations per click (4.2 against 5.2 per hundred clicks),
- 36,500 clicks per version on sales per click (0.84 against 1.04 per hundred clicks).
At 500 clicks a day to each version, that’s two days, two weeks and about ten weeks, before the leads have had time to be called or to close. Add a week to call the leads and a month for them to close, and the sales read lands three to four months after launch. The example’s 10,000 clicks per version are enough to read the conversion rate and the conversations, and nowhere near enough to read the sales.

So write the read dates into the test plan before it starts: the day contact rate is read, the day sales are read and the day value is read. Decide which number settles it, and hold the form until that day, whatever the landing page report says in the meantime. It cuts the other way too. A version that looks like a winner on its first few hundred leads hasn’t won anything yet.
Where the volume is too thin to read sales at all, read conversations per click first, because it’s the earliest number the drag is meant to move, and let the sales confirm it as they come in.
Tell the platforms what you’re after
The ad platforms see the drag too, and they react to it.
If the platforms count every form fill, the multi-step form in the example cuts their conversions by a third overnight and raises their cost per result by half. Automated bidding with a cost target bids to stay near that target, so when each result suddenly costs half again as much, it bids lower, wins fewer auctions and spends less. The test runs on less traffic than it was planned for.
Change what you count, and the drag and the bidding line up.
- Bid on the qualified conversion, sent once per lead from the browser and the server with one ID. The form sorts the visitors, and the bidding goes looking for more people like the ones who got through.
- Set the targets from what a sale is worth, not from last quarter’s cost per lead. A target set on the old form’s cost per lead will throttle the new one.
- Change one thing at a time. If the platforms still bid on every form fill, switch them to the qualified conversion first, let the campaigns settle, then launch the form, so each change can be read on its own. Changing what the campaigns optimize toward puts them back into learning, so don’t stack it on top of a form test.
- Keep enough for the bidding to learn from. Keep at least 30 qualified conversions per campaign in 30 days, plan for 45, and aim for 60 a month, double the minimum. A campaign at these levels can stay in Meta’s learning phase longer, and it holds up. On Google, target ROAS on Search typically needs at least 15 conversions in the past 30 days. If drag at the form and a qualified-only conversion together push a campaign under 30, consolidate into fewer campaigns first, then lower the line by one band, or bid on an earlier signal. Counting every form fill again undoes the point. The guide in Resources has the setup.
- Don’t let a testing tool pick the winner. A tool that moves traffic to the leading version on its own, scoring each version on form fills, will send most of the traffic to the single-step form within days. Split the traffic evenly and decide on click to sale yourself.
- Test the platform’s own forms the same way. A lead form that runs inside the platform can carry drag too. Meta’s Higher intent type runs only in the Facebook and Instagram feeds on mobile, and it gets judged like the site’s form, on contact rate and sales, never on cost per lead.
Put sales in the room before the test starts
So who’s driving? If the landing page report is the one everyone reads on Monday, the drag gets judged by the number that’s built to argue against it. Settle the scoreboard before launch, with marketing, sales and whoever owns the budget in the same room: which number decides it, on which date, and what happens if it’s close.
Drag changes the sales team’s day as much as marketing’s. Fewer leads come in, more of them pick up, and more of the calls are with people who qualify. If reps are measured on dials or leads worked, the drag looks like less work, and if anyone’s pay is per lead, someone will want the volume back. Measure and pay on sales and the value of the accounts, and the drag stops being an argument.
Speed matters more when each lead is worth more. Set a first-attempt window of an hour or less, and reassign any lead that misses it, with the credit staying with the rep it went to first.
The thank-you page is where marketing hands the lead to sales, so write it with sales. Name who will call and when. Some buyers don’t want a call at all, and a booking link, or an order link for a product that can be bought outright, lets them choose. Read that change the same way as the form, on contact rate and revenue.
What breaks
The same handful of things go wrong when drag goes in.
- The conversion rate fell because tracking broke. A second step that reloads the page, a lead event that fires at step one, a CRM that only saves step two. Before reading anything, check that each step’s count, the leads in the CRM and the lead events agree.
- The second step lost the wrong people. Read the step-one answers of everyone who stopped, by band, against everyone who finished. If the top bands drop as fast as the bottom ones, the step isn’t sorting.
- Drag stacked on drag. A second step, a texted code and a booking requirement, all launched together. Nobody can tell which one did what, and together they’re far more than one small ask.
- The phone number came off the page in the same release. The form gets the credit, or the blame, for calls that stopped coming.
- Sales changed during the test. A new rep, a new cadence, a holiday week, a week the phones were down.
- The platforms still counted every form fill. The bidding held back spend, and the test ran on a fraction of the traffic it planned for.
- The test was read on the first number in. The landing page report decided it on day ten.
- Partial records went to sales. Someone who stopped before the consent box never agreed to a call.
- Personal details went into the page address between steps. They end up in browser history, server logs and every tag on the next page.
- Nobody re-read it. Drag that sorted last year can stop sorting when the offer, the ad or the audience changes. Re-read the drop-off by band every quarter.
What to change this quarter
- Put the true conversion rate on the report. Click to sale by form, next to the landing page’s conversion rate, so nobody reads one without the other.
- Define contacted, and count it from the phone system, with an outcome on every attempt and bad data on its own line.
- Take out the friction. Taps before typing, both steps on one page, the button above the keyboard, the phone number on the page.
- Make the qualified conversion the one the platforms bid on, set the targets from what a sale is worth, and let the campaigns settle before the form test starts.
- Build a two-step version of your main form, with the sorting question first and the contact details second, under its own form ID.
- Split the traffic evenly and hold sales still, and write down the deciding number and the read dates before launch.
- Read who the second step lost, by answer band, and read sales by tier at three and twelve months.
- Keep whatever raised click to sale, and test the next piece of drag. The ad, the confirm step, the thank-you page, one at a time.
The landing page’s conversion rate will fall, and the report should show why in the same row. The visits that were never going to become sales sort themselves out at the form, and sales spends its day with the ones that will.
Four months on
The same report is on the screen, and the multi-step form still converts a third less often than the single-step one. This time there’s a second line under it, click to sale by form, and the multi-step form is ahead. The conversations it sent sales are turning into applications, and the applications are closing. Nobody asks for the old form back. The question in the room is where the next piece of drag goes.
Sources
- Claude C. Hopkins, Scientific Advertising (Chicago: Lord & Thomas, 1923), ch. 1. Public domain in the US. Free copy
- Albert L. Nichols and Richard J. Zeckhauser, “Targeting Transfers through Restrictions on Recipients,” American Economic Review Papers and Proceedings 72, no. 2 (1982): 372–377. IDEAS
- Vivi Alatas, Abhijit Banerjee, Rema Hanna, Benjamin A. Olken, Ririn Purnamasari and Matthew Wai-Poi, “Self-Targeting: Evidence from a Field Experiment in Indonesia,” Journal of Political Economy 124, no. 2 (2016): 371–427. doi:10.1086/685299
- Joseph Sugarman, The Adweek Copywriting Handbook (Hoboken, NJ: John Wiley & Sons, 2007), Axiom 3, p. 33. Publisher
- Robert B. Cialdini, Influence: The Psychology of Persuasion (New York: Collins, 2007; first published 1984), ch. 3, “Commitment and Consistency: Hobgoblins of the Mind,” p. 43. His site
- Meta Business Help Center, “About instant form types,” checked November 6, 2026. facebook.com/business/help/252352181957512
- Manasi Deshpande and Yue Li, “Who Is Screened Out? Application Costs and the Targeting of Disability Programs,” American Economic Journal: Economic Policy 11, no. 4 (2019): 213–248. doi:10.1257/pol.20180076
- Broad Eye Solutions, “Signals and Attribution Blueprint” (2026). The multi-step form, capture fields, events and the CRM’s contact stage behind the build in this article. github.com/BroadEyeSolutions/power-law-signals